


Real-time NFL Win Prediction with Machine Learning
Predicting game outcomes using play-by-play data.

This project predicts game outcomes in the National Football League (NFL) using Elo, linear probability models, and multivariate adaptive regression splines (MARS). Two types of Elo are tracked, over a ten year span (franchise success) and within a given season (season success). These Elo ratings are used to calculate pre-game competitiveness and win probabilities. Additionally, by using Elo ratings and play-by-play data as predictors, a linear probability model and MARS are used to predict real-time win percentage as a game progresses. Tuned MARS (R-squared = 0.44) serves as an advantage over multiple linear regression (R-squared = 0.39). Real-time prediction (binary win or loss as response) is also implemented, with an accuracy of 81% when using a MARS generalized linear model.
I have four main goals for this project. First, use Elo to calculate how competitive an NFL game is expected to be. Then, also with Elo, calculate the pregame expected win percentage for each team. I will also use Multivariate Adaptive Regression Splines (MARS) to predict the pregame win percentage. I create a linear probability model (without regression splines) for comparison. Finally, I will create a plot that tracks live predicted win percentage throughout the game. The pregame analysis is done to give the fan an idea of what to expect during a game (if there are multiple games at once, which will be more fun to watch?) while the live win percentages may key fans in on how games progress.
* Note that if I wanted the non-MARS model to be my main specification, I would use logistic regression instead of linear probability. For my use though, a linear probability model allows for an easier comparison of marginal effects with MARS.
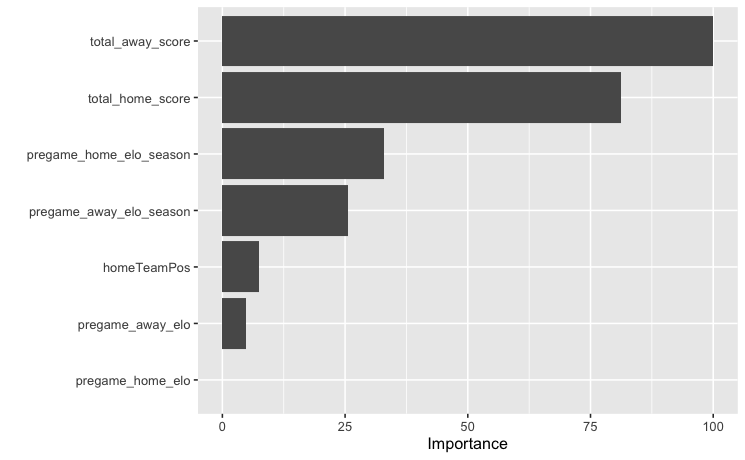
Variables used for this analysis are as follows:

I will provide a baseline linear probability model here, so you can understand the variables used and their significance before discussing MARS:

First, to calculate how competitive a game is expected to be, I build a distribution of the pregame Elo differential between two NFL teams. Using this distribution, I can create a cumulative distribution function (CDF) to calculate percentiles for the pregame Elo differences. For example, the Miami Dolphins vs. New York Giants game on 12-14-2015 has an Elo difference in the 75.9 percentile. This means, using the pregame Elo difference, the Dolphins-Giants game is expected to be more competitive than 75.9% of games.
When using Elo to calculate the expected win percentage of the Miami Dolphins (the home team) we are given a value of 0.525, or 52.5%. This means Elo would predict this game to be more or less a toss-up. Note that Elo by itself doesn’t take into account home field advantage in this model, as to not count it twice when including it as a predictor in the MARS model. When applying the linear probability model, it gives Miami (the team with home-field advantage and a slightly higher Elo) a pregame win percentage of 65% and MARS gives a pregame win percentage of 70% to the Dolphins. In this case, I would expect the linear probability and MARS models to paint a better picture of who’s expected to win. This is because it takes home-field advantage into account and Elo rating. For an ESPN description with a full summary of this game (which will be discussed subsequently) click here.
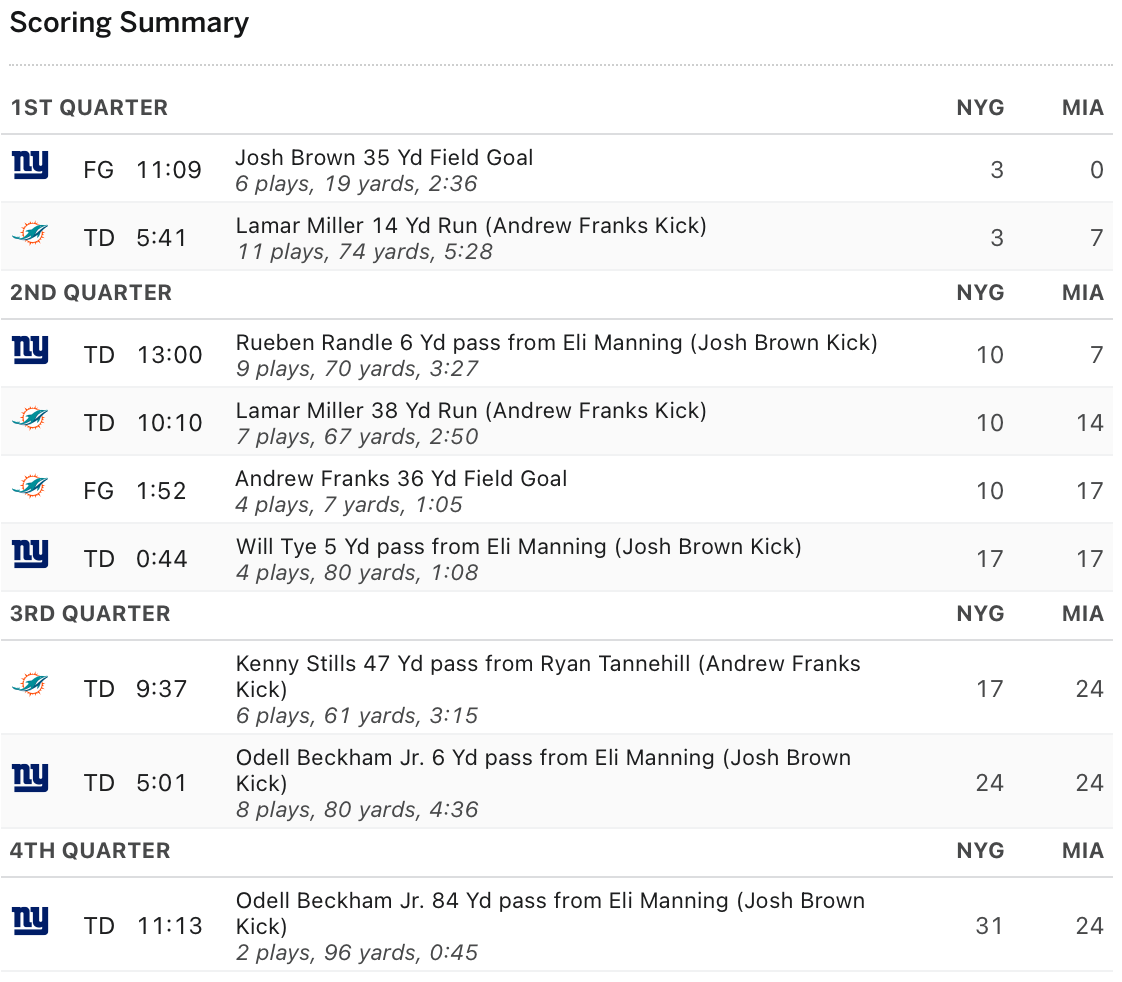
This game itself was quite exciting, with a lot of back and forth. Miami jumped to an early lead, but New York evened the score going into the half. Midway through the third quarter, Miami scored a touchdown to give them a lead, but two Odell Beckham Jr. touchdowns in the third and fourth quarters brought the visiting Giants the win. Keep this in mind as you look at the live win probabilities for the two models I fit:

When reading the above graph, the X-axis shows the time of the game (each quarter and the end of the game is marked) and the Y-axis shows the probability of Miami (the home team) winning. Think of the probability of 0.50 on the Y-axis as an even split between the two teams. Anything above Y = 0.50 is in Miami’s favor, and anything below it is in New York’s favor. The red line shows the live win percentage prediction using the linear probability (glm) model and the blue line represents MARS. Although both models generally follow the same trends, there are a couple of key differences worth pointing out.
First, it is interesting that MARS tends to be more extreme with the predictions and linear probability much more conservative. Because this game was close, neither team was given an extreme probability of winning until the Giants pulled away in the fourth quarter. When the Giants took the lead, MARS did a better job of realizing that. I also think that the linear probability model overvalued home-field advantage, as even when the Giants were closing the game out in the fourth quarter, regression never gave them a 75% chance of winning. MARS on the other hand, jumped to nearly 90% chance of winning which makes much more sense: although it was still a one-possession game, when the Giants had the ball to close the game out it was very unlikely that Miami could pull off a miracle.
What is the most interesting to me though, is that MARS, which had been favoring the slightly higher rated (and home field) Miami team for the first half, recognized that by tying the game midway through the third quarter, the Giants were now favored to win. This is likely because of the regression splines, but the momentum swing is super interesting: for nearly a full quarter of the game, it had the Giants slightly favored while the linear probability model preferred the Dolphins. Furthermore, this supports the large jump in classification quality (MARS beating the linear probability model).
Although neither of the models was super accurate in this game (it was a neck-and-neck game between two competitive teams) they do a good job of telling the story of what happened. I specifically chose this game because of its back-and-forth, competitive nature. Furthermore, MARS outperforms linear probability, likely because of the benefits of regression splines. I am still amazed that MARS recognizes the lower-rated, away team had a better chance of winning when they tied the game in the third quarter.
Although I focused on one specific game in this case study, it could easily be scaled to describe any NFL game. A major benefit of this analysis is that the models can be applied before a game is finished. It was trained on ten years of play-by-play data and would be relatively straightforward to implement as a web application.
Beginning with pregame competitiveness, pregame win prediction using Elo, linear probability, and MARS, and finally showing live win percentages are all key features that any casual fan can enjoy. I am overall very pleased with how the applications of this project turned out, and there is always room for more applications to be added!
Thanks as always for giving this a read. I’ll include a little more detail on the MARS model in the Appendix (below this) if you’re interested. Please let me know if you have any suggestions for improvement!
Appendix
The MARS specification/coefficients, if you are interested:

The data used for training the model include games from 2008 to 2019, so one quick re-run with more recent data may be worthwhile for today’s NFL. The coefficients may adjust slightly but I believe all ideas and variables used would still apply.