


Chartbook - Paths to the NBA Draft
Fast Break: Visual explorations of the NBA Draft over time.


In this fast-break article I’ll investigate non-NCAA draftees using data visualizations. With the goal of getting towards a comprehensive draft model, this type of exploratory analysis is both fun and helpful. Think of this article as a quick “chart book” with the goal of better understanding where NBA draftees come from.
The charts in this write-up are interactive, and you can tap or scroll over different features to learn more. If you’re reading this in the Substack app or in your email inbox, click on a chart to view it interactively.
Chartbook Contents
Sources of non-NCAA Draftees
Table
Map
Trends Over Time
Historical sources of drafted talent
NBA and the internet
Bonus chart: Age of draftees
Why Investigate non-NCAA Draftees?
With the rapid growth and globalization of the NBA, international teams have quickly become viable options for basketball talent. By exploring unique sources of talent, I’ll get a much better idea of how I can appropriately capture it in a subsequent model.
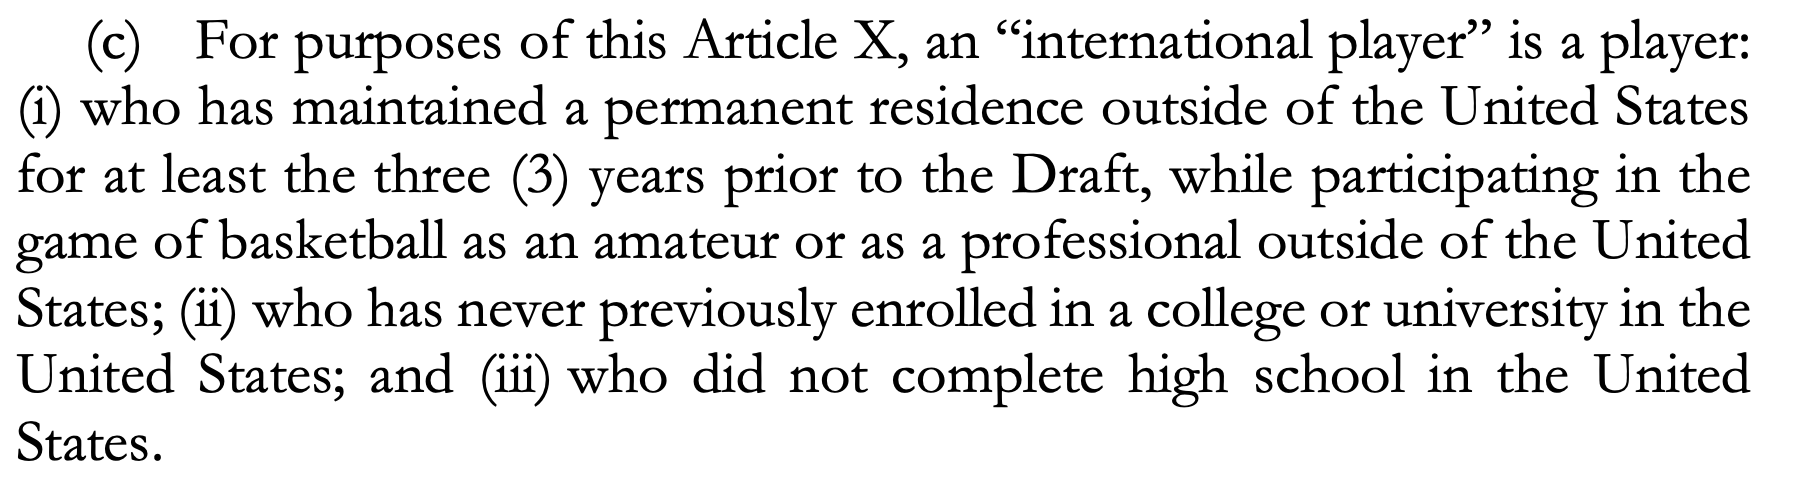
I think it’s also worth defining an international player for this analysis. The NBA’s collective bargaining agreement defines an international player as such:
For the sake of my analysis though, I’ll use a different definition. Instead, I’m only interested in where a player was, the year before the draft. I’m doing this with a draft model in mind. I want to track the team someone plays for, before they go to the U.S. This would help me appropriately capture the leagues from a player development perspective, which is my main focus.
The first chart shows where talent is coming from, since 1990. This table is helpful for deciding which leagues to add to a draft model after the NCAA. Comparing the structure, difficulty, and schedule of these different leagues would also be interesting.
This second map is the same as the previous table, but now it excludes NCAA and U.S. high school players. This is intended to get a geographical idea of where the talent is coming from. This map supports the idea that EuroLeague is a valuable addition to any draft model.
Trends Over Time
The above chart is fairly straightforward. It’s worth clarifying what the “other” category is: in 2000 it represents the “International Basketball League” and in 2023 represents Overtime Elite.
NBA and… The Internet?
Based off of a trend I noticed in the previous graph, I decided to compare U.S. internet access to the number of international draftees. I’m not arguing a causal relationship here, rather a cool trend. Between 1990 and 2003, the two factors have a correlation of 0.9159, statistically significant at the 1% level. This supports the idea that as more people got internet access, the number of international draftees also increased.
The internet would undoubtedly help international scouting, and also potentially help young talent find the league. I’ll make the argument that there are two distinct steady state values for the number of international draftees: pre and post-internet. Obviously, there are other factors at play here, but it serves as a nice way to split things up.
This chart isn’t too helpful in putting together a draft model, but a cool trend to share. It also suggests that data before 2010 may not be worth including when putting together a draft model.
Bonus Chart: Age of NBA First-Rounders
![r/dataisbeautiful - Ages of NBA Draft picks, 1984-2019 [OC]](https://substackcdn.com/image/fetch/$s_!gaFb!,f_auto,q_auto:good,fl_progressive:steep/https%3A%2F%2Fsubstack-post-media.s3.amazonaws.com%2Fpublic%2Fimages%2Fe1a329fe-34e4-45d2-b7f0-30326023fc37_640x426.png "r/dataisbeautiful - Ages of NBA Draft picks, 1984-2019 [OC]")
The above chart isn’t created by me, rather an interesting one I’ve come across a few times now. It’s a slightly dated but great chart, made by two now-NBA analysts (one at the Nuggets and the other at the Spurs). It likely confirms your existing beliefs on age trends in the draft, but still worth being sure of.
Using age in a draft model is beneficial from two standpoints: young talent is more valuable than the equivalent older talent. Also, if a player is 21 and still not in the league, there is likely a reason for that. Appropriately discounting their value accordingly is likely a valuable addition.
Thanks for giving this article a read. For any questions or to continue the conversation, reach out at vaughnhajra@gmail.com or on X/Twitter @vaughnhajra.