Building an R Shiny App in R Studio
Click Here to Try the Shiny App Yourself!
After creating an effective simulator, I wanted to be able to share it with others to simulate NBA games on their own. Not only was this a good learning experience for me, but it also made me think about how one could present this project to someone with no coding or basketball experience, and still be able to convey a message. I knew I wanted some sort of chart or graph that would summarize game outcomes, and I also wanted to highlight a few key statistics of the two teams the user selected.
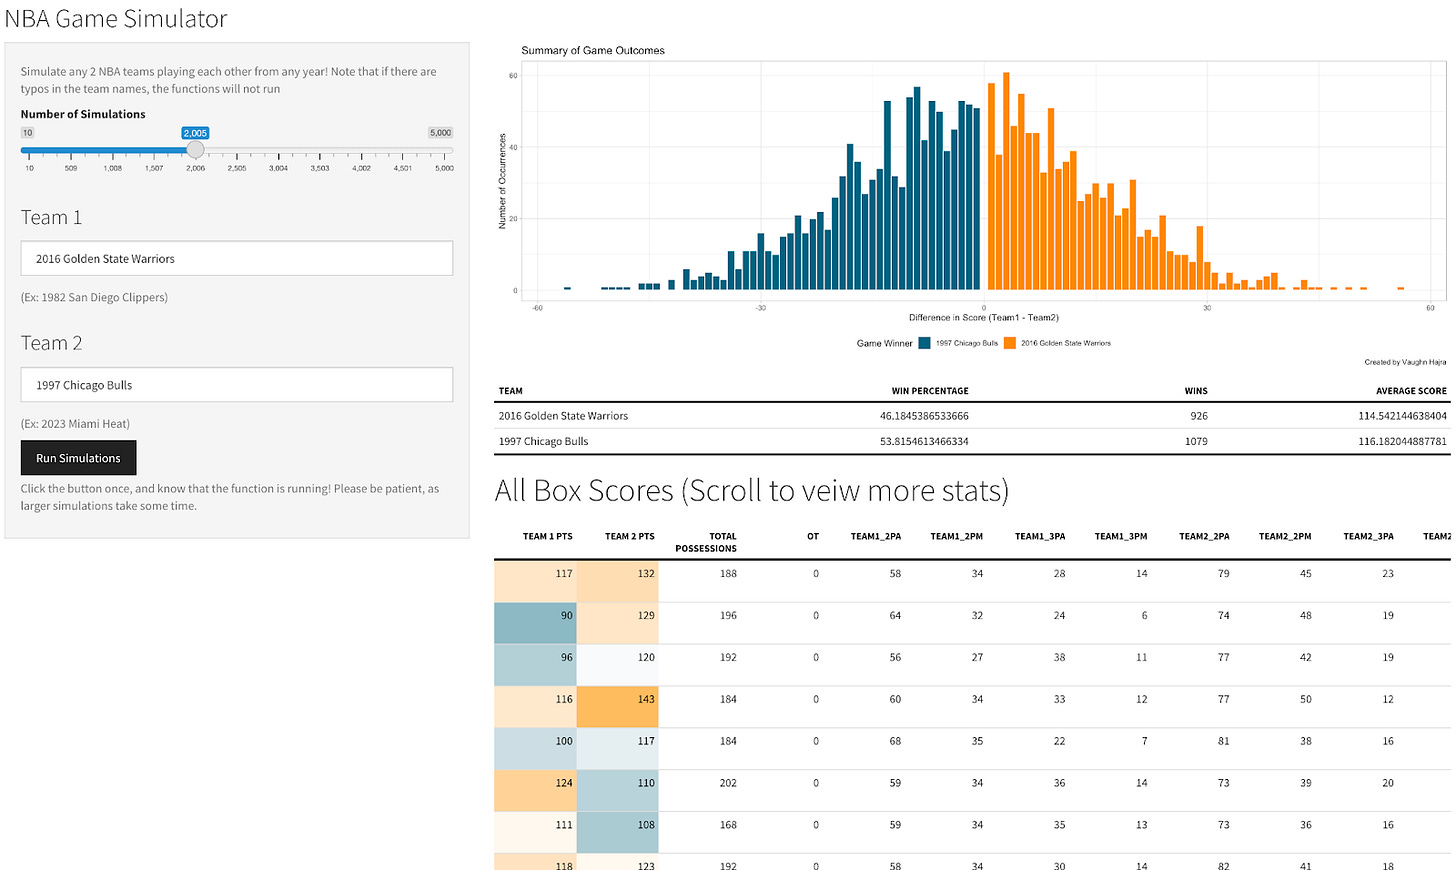
After lots of experimentation (Grant Culbertson was also very helpful in creating the Shiny App) I decided on the following inputs: two text fields for the user to type in the team names, and a slider (10 to 5,000) for the number of simulations. I decided to use the cosmo Shiny App theme, and imported my functions into the Shiny App’s server. The sidebar included the inputs, and then the web page’s main area starts blank and then populates with a histogram and two data tables once the simulations are completed. The webpage layout is as shown below:
To create the tables, I used the reactableftmr package (the package documentation was very useful). The biggest benefits of this package were that I could build custom interactive tables, with features including: sorting by column, including a number of rows equal to the number of simulations, and coloring and renaming specific columns. The reactable tables also had a theme to look just like a table you would find on fivethirtyeight, which I thought was great.
The main table, below the histogram, shows the three takeaway stats in addition to the team names: win percentage, number of wins, and average score. These metrics were selected as key takeaways that would tell a story without confusing the user. Then, I also included a table with box score stats, so if someone was interested in looking at individual game results, they would still be able to find them. Overall, the reactable tables were very intuitive to set up, and also very user-friendly.
The final step was to add the histogram to the page. I created a “differenceBinary” variable to be equal to “ _team name_ Wins” when each respective team won a game. Then I made the color of the histogram equal to that variable, and finally I matched the color palette to the fivethirtyeight reactable theme. I also wanted to highlight each individual score differential, so I set the bin size equal to one. Lastly, it is worth noting that because of the overtime clause (basketball games can’t end in a tie), the score differential is never equal to zero.


